

Moving Anchor Charts Off the Wall
- Oct 14, 2025
- 4 min read

Anchor charts are co-constructed ‘posters’ that are visible, accessible, and updated as learning grows. They typically live on the walls of classrooms or learning spaces. An anchor chart supports students' learning because they don’t have to hold all the information in their heads.
But here’s the problem:
Some students find that the act of looking up and finding the information gets in the way of their learning.
Wall space is limited and quickly clutters.
Access isn’t equal—placement and vision challenges matter.
Charts risk becoming decoration instead of thinking tools.
What might be different if the anchor chart was in every student’s hands? Literally!
Why Mini-Anchor Charts?
Shrinking charts into smaller versions, which can be handled and ‘owned’ by students, transforms them into active learning tools.
Research backs this up:
Cognitive Load Theory shows learners benefit when supports are close at hand, reducing split attention
Dual Coding Theory highlights the power of combining visuals with text for memory and retrieval
Metacognition and Self-Regulation guidance notes that prompts like checklists and visuals help students plan, monitor, and evaluate their learning
Visible Learning synthesises that success criteria and worked examples have high impact on progress
Universal Design for Learning (UDL) encourages multiple means of representation so all learners can access supports
Idea 1: Make it mini

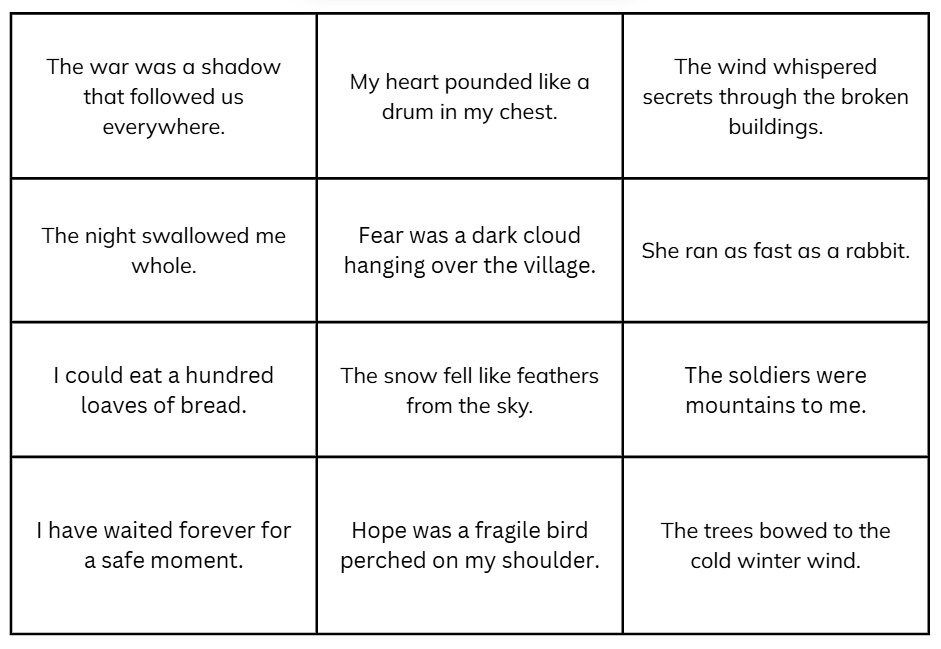
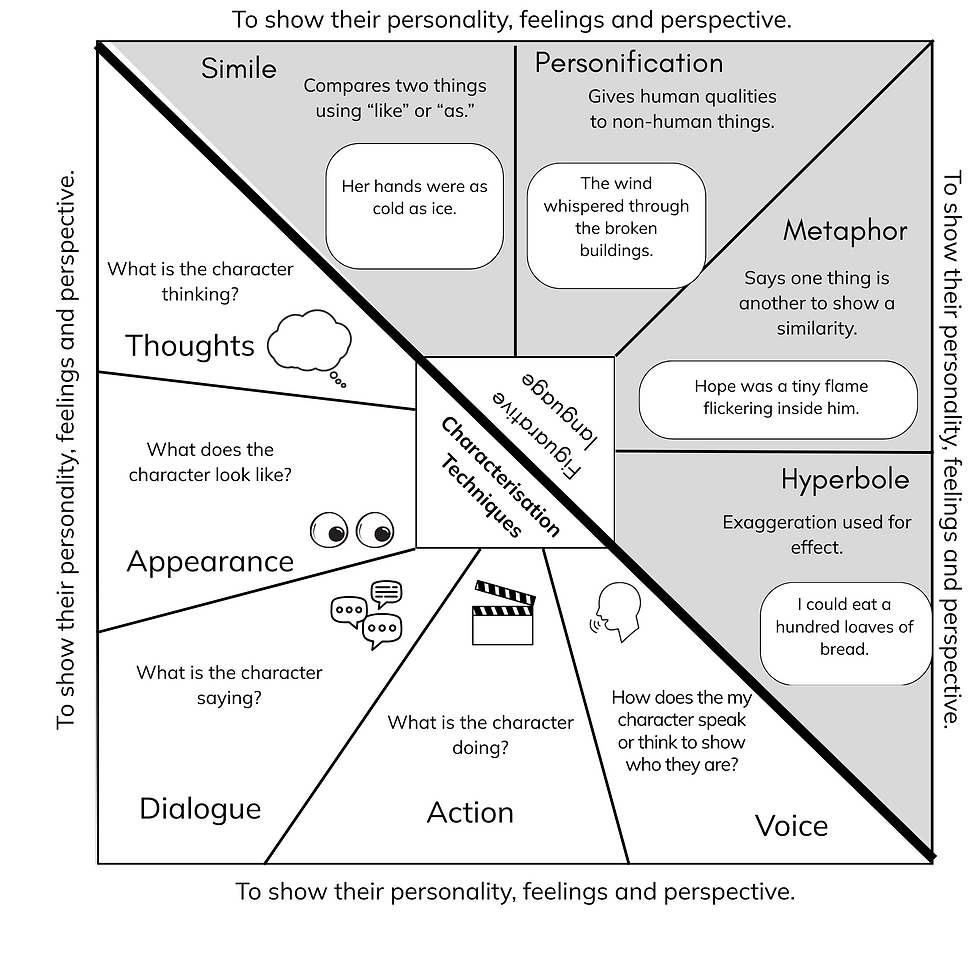
This example comes from Gulgong Public School, NSW, who have been focusing on self-assessment as a learning strategy. Stage 3 students engaged in a Know Show, Heat Map (Figure 1), Figurative Language Sort (Figure 2 and 3), and then used a mini-anchor chart (Figure 4) to check their accuracy and begin to refine their writing.

Other ideas from teachers at Gulgong Public School for using the mini-anchor chart include:
personalising using colour and/or adding your own symbols and notes,
a base for further note-taking by pasting it into the middle of a page and adding ideas around,
a tool for analysing texts on a Bump It Up Walls,
a reference for future retrieval practice.
How might you take this idea and increase the level of co-construction with students?
Idea 2: Make it your own
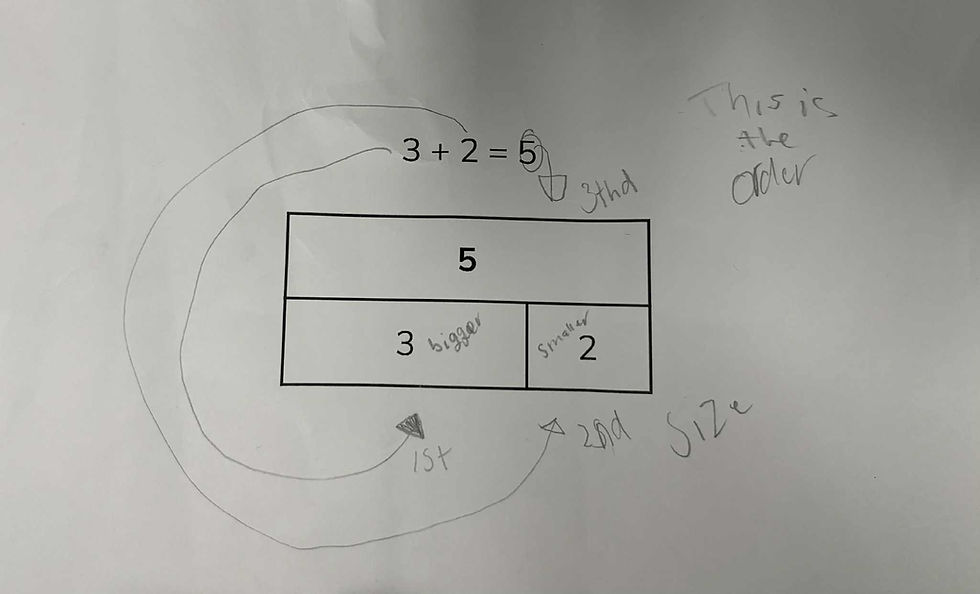
This example comes from Mudgee Public School, NSW, and was used with Stage 2 and Stage 3 students to support Peer Feedback. Students talked with a partner about each of the examples of a bar model to decide if it was accurate. (Figure 4)

The teacher then used the comments from students about what made them accurate to co-construct a criteria for an accurate bar model.

Each student was then given their own mini-anchor chart (Figure 5) where they could add their own annotations to help them remember how to construct an accurate bar model. The teacher modelled their own notes on the board. Students were encouraged to use arrows, words and colour. (Figure 6)
They then used this to support construction of their own bar model for a problem. The mini-anchor chart is also used as a reference to give feedback to a peer about their bar model.
Here is another example (Figure 7). This is from Mudgee Public School, Stage 3 team.

Some questions that arose:
How might you check for accuracy of each student's anchor chart?
How might you scaffold for those who find the annotations too challenging?
How might you take this idea and increase the level of co- and self-construction with students?
Another idea (or 5)
5 more practical ways to move anchor charts off the wall:
Foldables: Mini anchor charts as fold-outs in notebooks.
Combining note taking and visuals: You might get some inspiration from Wheel Organisers Checklists or templates for ‘doodle notes’ or guided notes where students use frames and cloze sentences and phrases to add their own detail. See the image showing Cornell Notes and Guided Cornell Notes for Secondary Biology here. Watch a video about Guided notes and see additional links here.
Mini-Versions of Bump It Up Walls. This example (Figure 8) is from Vale Park Primary School, South Australia where the students learning Japanese can take a mini-version of the Bump It Up wall to their work and use it for peer and self-assessment.

Figure 8 Reference cards: These can be pre-made or blank note cards that students add to themselves. Make them into a set using a hole punch and a curtain hook.
Take-home tools: Copies for families to see and use.
Anchor charts are thinking tools, and when we put them directly in students’ hands, they become living resources.
Mini-anchor charts make learning portable, personal, and powerful. We'd love to hear how you innovate on these ideas. Please feel free to share at learning@ct-ed.net


Comments